Showing posts with label screencapture. Show all posts

Wednesday, January 15, 2020

Hello World, from MathPaint! (Preview)

If you've been following Mathaesthetics posts you've seen a variety of images shared - different types of generated art from fractals to repeated 2D plots to vector fields and scalar fields and more.

All images on this blog are created by our flagship software product, which has been in development since November 2019. Today for the first time I'm publicly sharing some screenshots of the user-interface, starting with a few document windows:

Hello World, from MathPaint!

These MathPaint documents were used to create our app icon and current Facebook cover.

MathPaint is a Mac OS desktop application written in Swift. A private beta release is planned for February 2020, and the completed 1.0 application will be released later this year, through the Apple AppStore.

CoreImage effects can be applied to any MathPaint canvas
I've always felt that creativity and mathematics belong together. MathPaint is designed for creative professionals who would like to harness of of the endless generative capability of mathematics to create visual forms, patterns, textures, and algorithmic art. You don't need to be a programmer to create such designs with MathPaint, and the release will include visual templates and presets that are intuitive to browse and modify, plus cool automation features:

The "Repeater" feature can add multiple iterated re-renderings to a model

I also think MathPaint is a natural tool for students. While there are robust software products for mathematical modeling and computation, MathPaint focuses on aesthetics and uniquely permits the creative impulse to guide mathematical learning and exploration.

I will be using MathPaint to make art, and I hope to see a community of makers who create original expressive work with this software. Even algorithmic artists used to coding may find some rewarding features and workflows with this tool.

Document settings give you a page-layout app's control over your math-art canvas.

Now that the first screenshots are out, look for weekly updates and posts on MathPaint progress! And of course, a continuing stream of art, including our Fractal Friday posts, all made by MathPaint.


Friday, November 15, 2019

Fractal Friday! 2019.11.15

This week I'm beginning a new series of postings, to celebrate the implementation of a fractal renderer in our flagship product - Fractal Friday!


Click on each image to see it full size. These are window captures at screen resolution; our final product will also support higher resolutions and larger sizes.


This first collection was produced from early prototype implementations of our renderer - four regular Julia set fractals, and this Mandelbrot set image:


A variety of modes of color mapping, starting values, and iterative depths were used - these options will be interactive features of the product.


Every Friday we'll post more! It's an endless area to explore - both the mathematical worlds of these equations, and the aesthetic possibilities of color mappings and renderings.


Feel free to follow Mathaesthetics on social media (Twitter, Instagram, Facebook), or follow this blog's RSS feed for more. Happy First Fractal Friday!

Thursday, November 7, 2019

Prototype images - fun with iterator objects

Here are some screen captures (also on our Instagram and Facebook feeds) from the flagship work-in-progress.

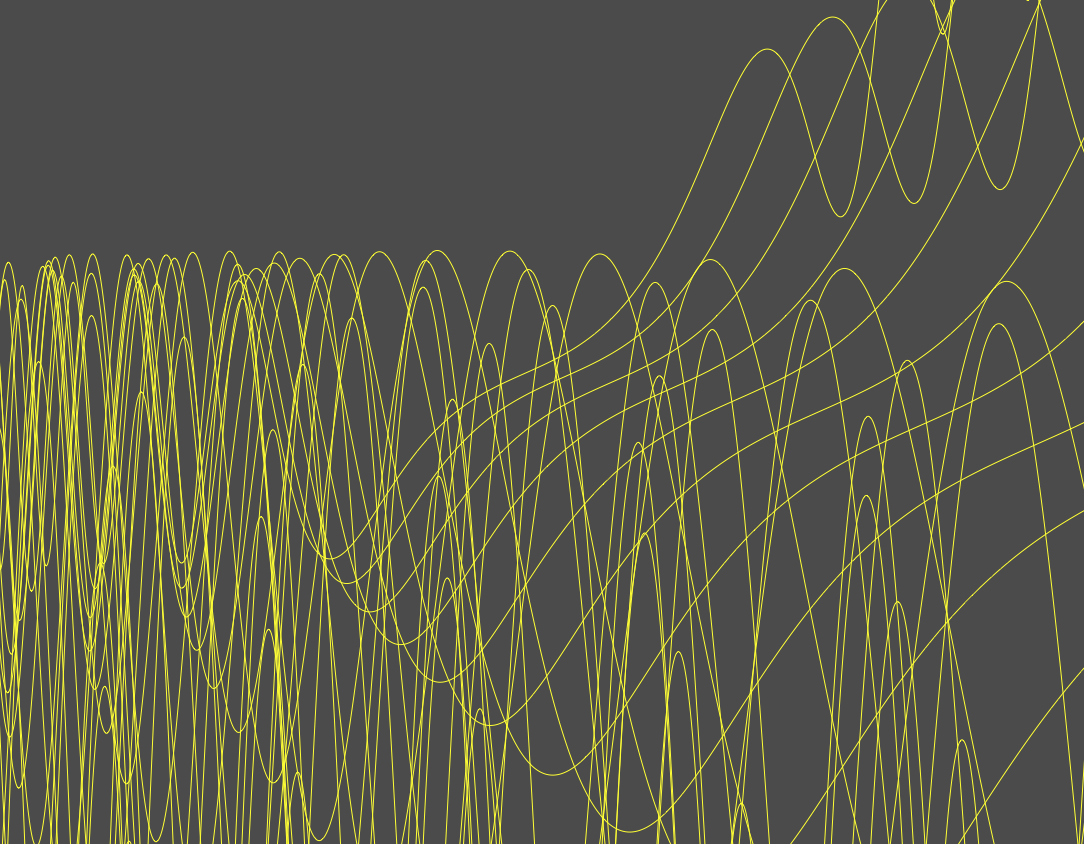
Today I was working on the idea of an iterator object which is an abstraction of repeated drawing with some incremental parameter change. The prototype has two iterator objects applied - one applies a gradual zoom to the target layer, while the other gradually shifts the origin (including a slight multiplier that increases with each iteration, so the origin is actually moving in a gentle exponential curve).

 I like the results with each layer, but the really cool thing is that the iterator objects applied in each case are identical - so there's a clean separation of the concept from the underlying rendering mechanism. The first image is a cartesian function plot (it's an f(x) = x^3 + sin(x^3) function, with some coefficients).

The second image is just a set of few shapes (three circles, two ellipses, two line segments). The iterator objects produce the repeated results in each rendering.

Below are few more images of these two renderings from different zoom levels.


Much more to come!